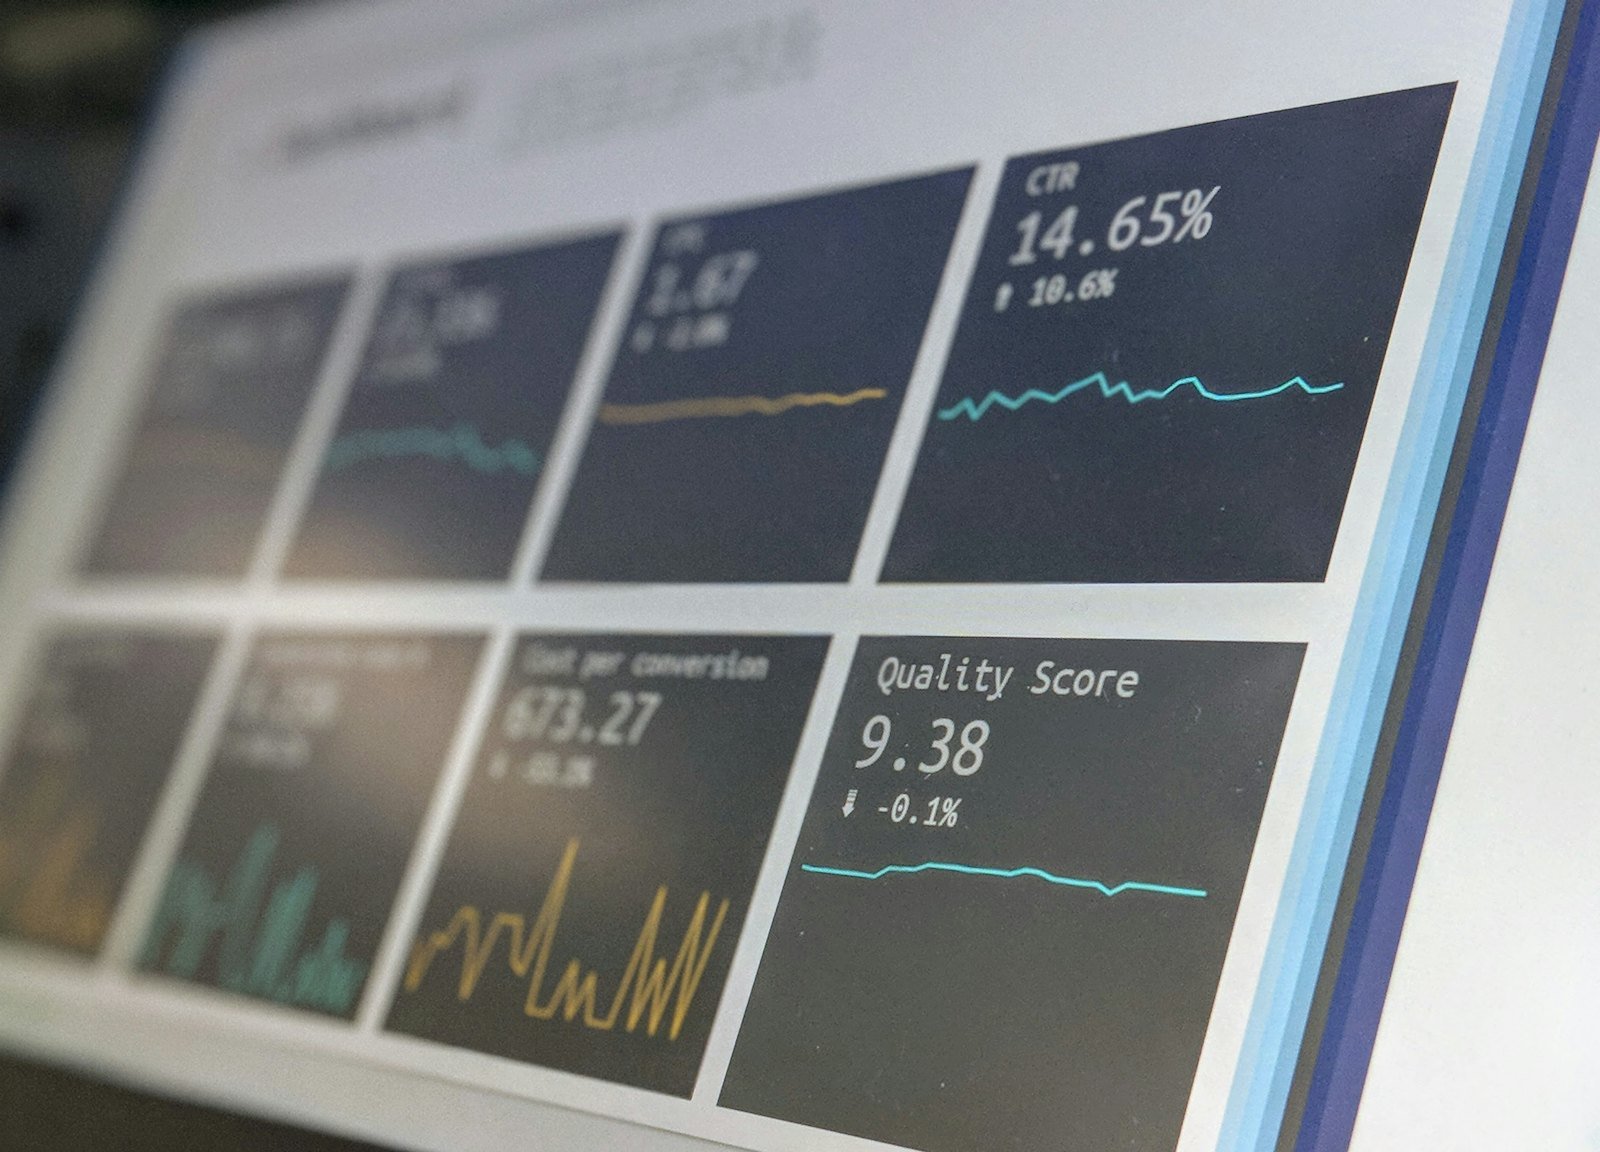
Business Intelligence (BI) dashboards are essential tools for seeing and understanding how your business is performing. When well designed, they turn complex data into clear, readable and directly actionable indicators.
The first step is to define the right KPIs (key performance indicators), linked to your strategic goals. Too much data kills the data: focus on what matters, with simple visuals (charts, gauges, maps) that are easy to read. A consistent colour code and a clean design also improve the user experience.
A good dashboard does more than describe the current situation. It should also let you compare performance over time, detect anomalies and even predict future trends. Modern BI tools such as Power BI, Tableau or Looker Studio also offer interactive exploration and custom alerts.
In short, an effective dashboard helps you steer your business, spot opportunities and anticipate risks. It becomes a true strategic management tool.
Need a dashboard for your business? Discover our Power BI dashboards & reporting services.